
The Fourier Ultra Toy
Can a perfect training fit predict well?
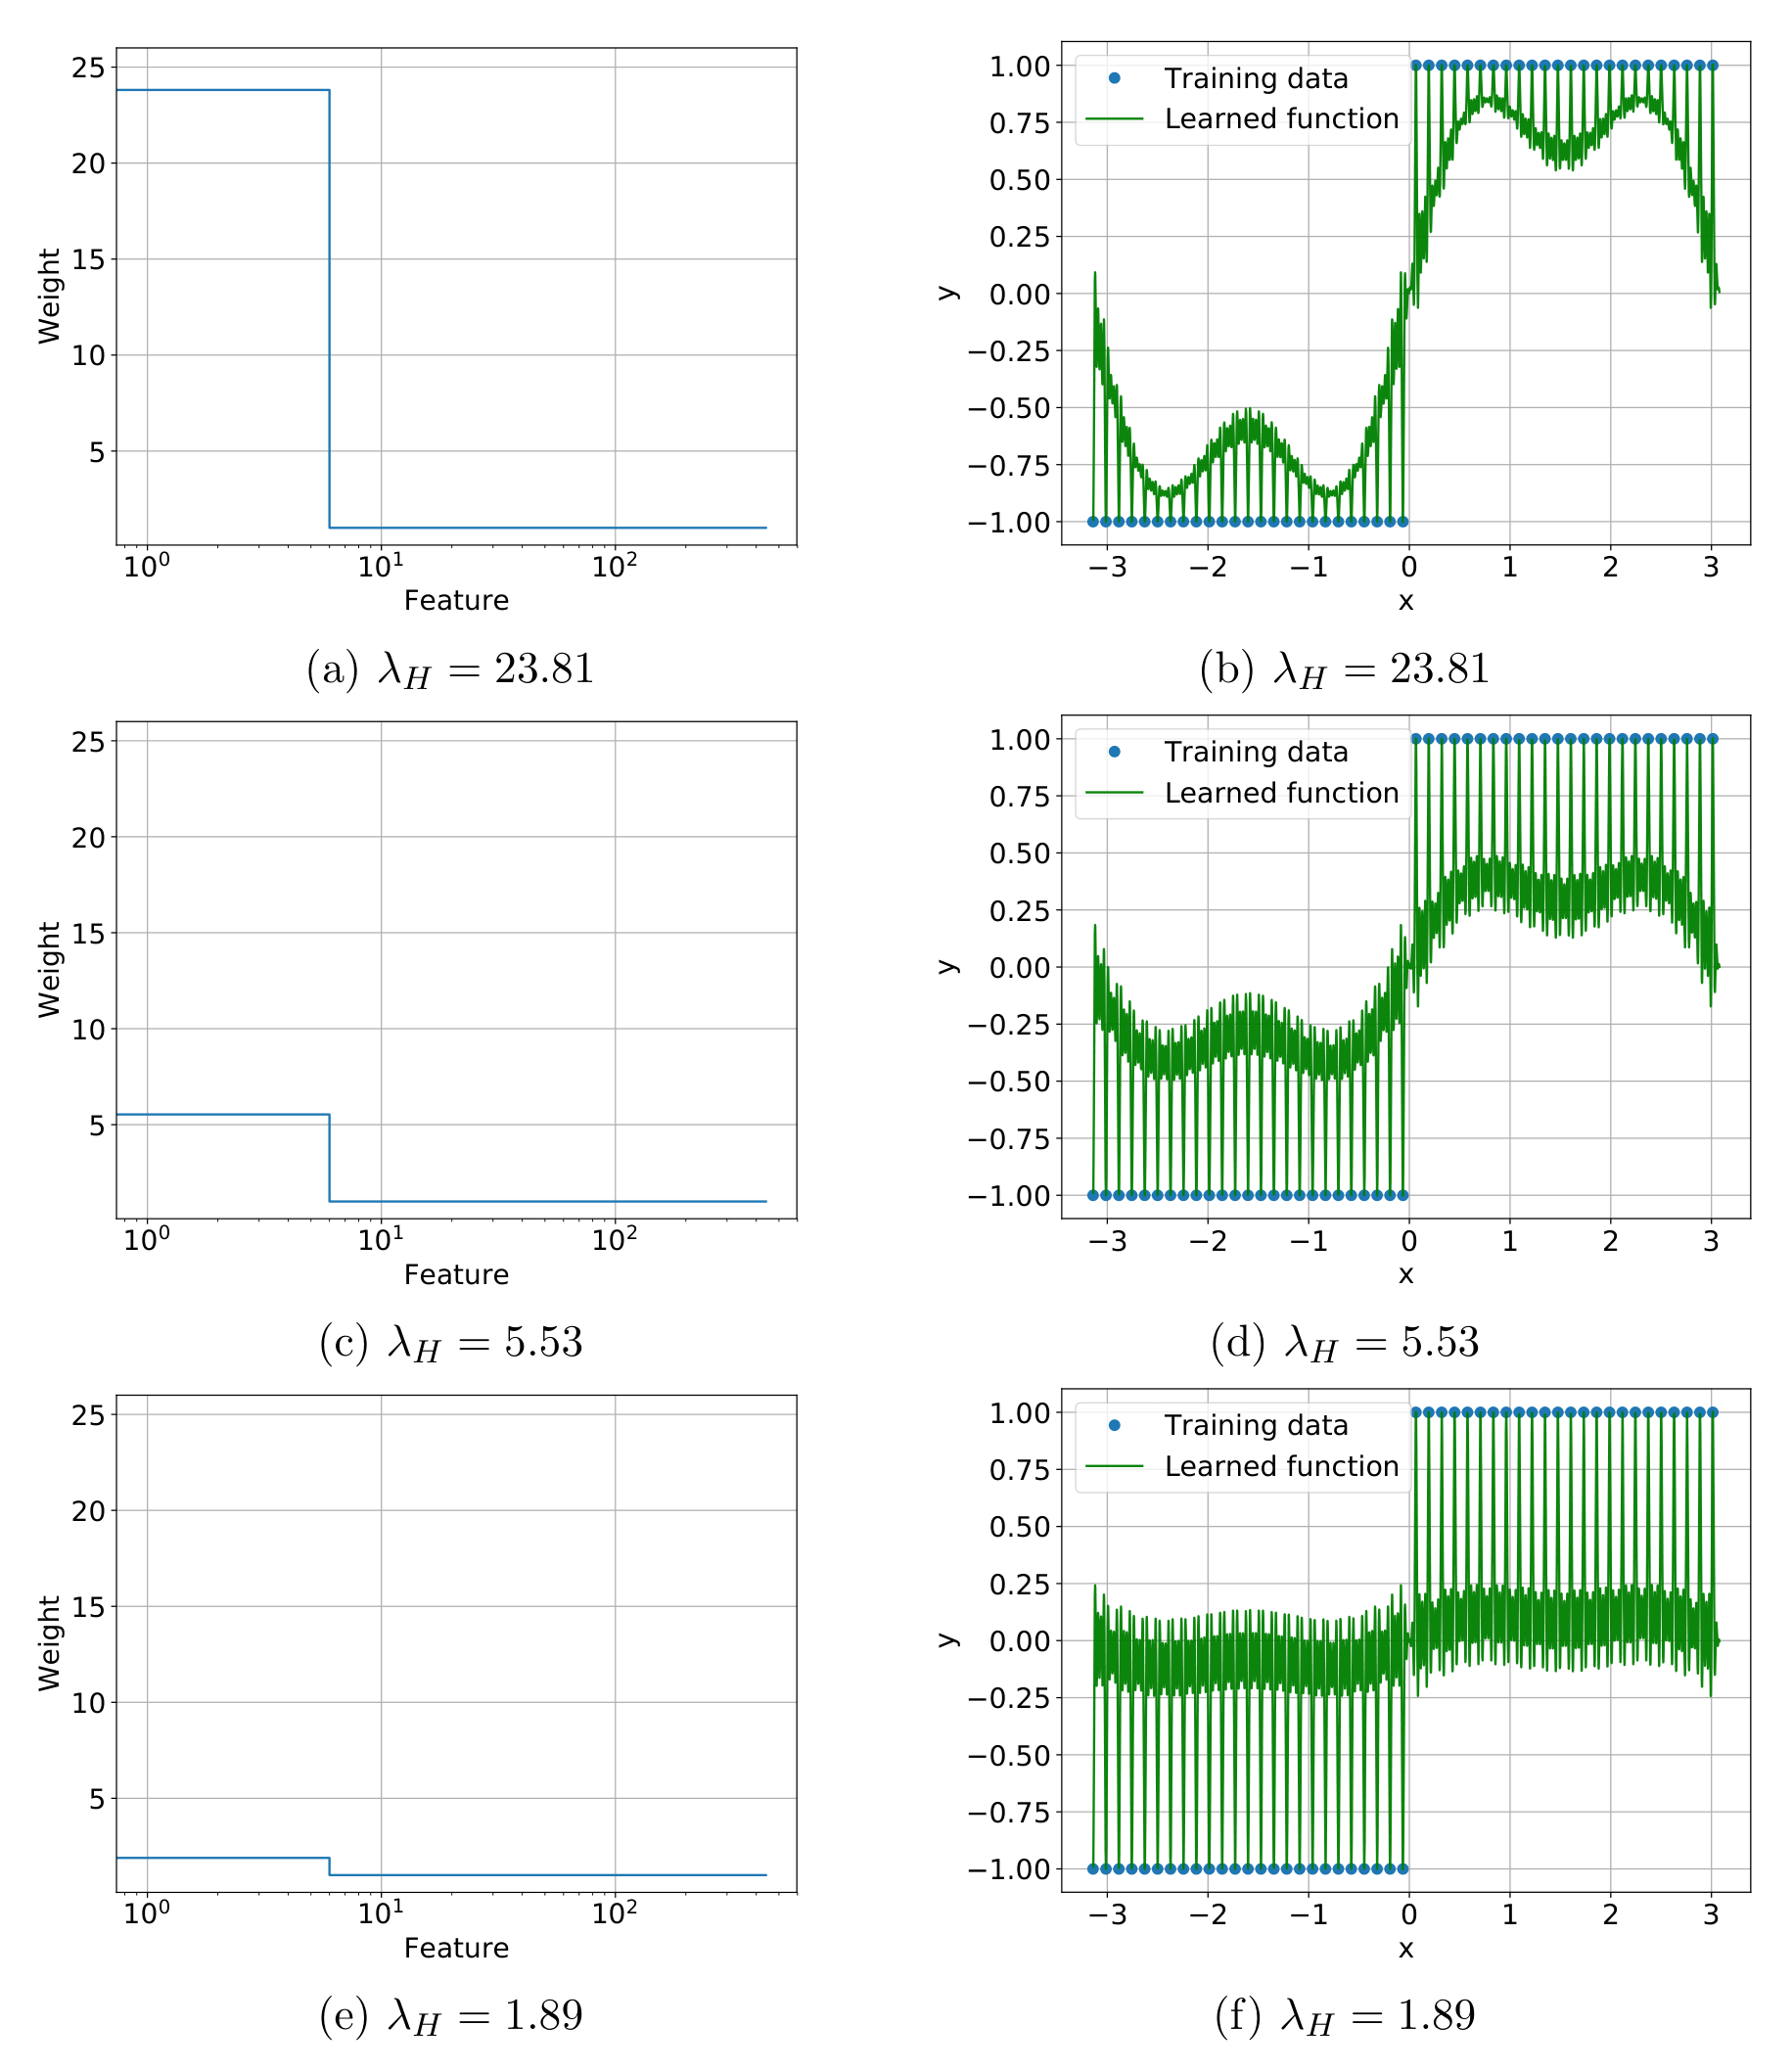
Compare one alias block with nine while keeping preference fixed. Both fit the orange points; watch the curve between them and its test error.
n = 49 samples · d = 441 features · s = 7 favored
┄ Target━ Minimum-norm fit● Training labels
Training MSE0.000
Test MSE0.007
Sign errornot scored
Low-band survival92.3%
Check other assumptions
Try other targets, noise levels, or favored frequency bands after comparing feature count and preference.
The preference applies to frequencies −3 through +3.
Exact model and numerical audit
Frequencies in one residue class modulo n are exact aliases on the regular grid. With feature masses lambda_k and sampled coefficient c, the weighted norm is sum |a_k|² / lambda_k, subject to sum a_k = c. Its minimum assigns a_k = c lambda_k / sum(lambda_aliases). The implementation uses the equivalent complex Fourier notation from the JSAIT treatment and always returns a real function.
n=49, d=441, s=7, favored |k|<=3
low-frequency mass=96.000000
max |f_hat(x_i)-y_i|=< 1e-12
train MSE=< 1e-12